

Estimated reading time: 10 minutes
Table of contents
- How to Actually Evaluate a Stock (Before You Buy It)
- 1. Fundamental Analysis — The Business Behind the Ticker
- 2. Technical Analysis — Reading the Chart
- 3. Valuation Models — What Is It Actually Worth?
- 4. Qualitative Analysis — The Stuff the Numbers Don’t Show
- 5. Comparing Approaches — Which One Should You Use?
- 6. The Warren Buffett Framework — Buy Wonderful Companies at Fair Prices
- 7. The Motley Fool Approach — Growth, Story, and Long-Term Conviction
- The Bottom Line
How to Actually Evaluate a Stock (Before You Buy It)
A no-fluff guide to the metrics that matter
Most people buy stocks the wrong way. They hear a ticker symbol on a podcast, see it trending on social media, or watch a friend brag about gains — and they buy. No research. No framework. Just vibes and FOMO.
That’s not investing. That’s gambling with extra steps.
If you want to build real wealth through the market, you need a repeatable process for evaluating whether a stock is worth owning. The good news: it doesn’t require a finance degree. It requires knowing what to look for and why it matters.
Here’s a breakdown of the most powerful ways to evaluate a stock before you put your money behind it.
1. Fundamental Analysis — The Business Behind the Ticker
Fundamental analysis is about answering one core question: Is this a good business?
A stock isn’t just a number on a screen. It’s a fractional ownership stake in a real company with real revenue, real expenses, and real leadership. Fundamental analysis forces you to look at the company itself.
Key Metrics to Know:
Price-to-Earnings Ratio (P/E) This tells you how much you’re paying for every dollar of earnings. A P/E of 20 means the market is paying $20 for every $1 the company earns annually. High P/E can mean the market expects big growth — or it can mean the stock is overpriced. Compare it to industry peers, not in isolation.
Earnings Per Share (EPS) How much profit the company generates per share of stock. Growing EPS over time is one of the strongest signals of a healthy, expanding business.
Revenue Growth Is the company making more money year over year? Revenue growth doesn’t guarantee profit, but stagnant or shrinking revenue is a red flag — especially in a growth-focused sector.
Profit Margins Gross margin, operating margin, and net margin tell you how efficiently the company converts revenue into profit. A company with 40% net margins is a very different animal than one operating at 3%.
Debt-to-Equity Ratio (D/E) How much debt is the company carrying relative to its equity? High debt isn’t always bad — but it adds risk, especially when interest rates are elevated. A D/E ratio above 2.0 warrants a closer look.
Return on Equity (ROE) This measures how effectively management uses shareholder money to generate profit. Consistently high ROE (15%+) is often a sign of a durable competitive advantage.
2. Technical Analysis — Reading the Chart
If fundamental analysis is about the business, technical analysis is about market behavior and price psychology.
Technical analysts believe that price movements follow patterns — and that those patterns repeat because human emotions (fear and greed) are consistent across time. This approach is more useful for timing entries and exits than for long-term buy-and-hold decisions.
Key Tools:
Support and Resistance Levels Zones where a stock has historically stopped falling (support) or stopped rising (resistance). These levels often become self-fulfilling because so many traders watch them.
Moving Averages (MA) The 50-day and 200-day moving averages are widely followed benchmarks. When a stock’s price crosses above its 200-day MA, it’s often seen as a bullish signal. When it falls below, caution flags go up.
Relative Strength Index (RSI) A momentum indicator scaled 0–100. RSI above 70 typically signals overbought conditions (potential pullback). Below 30 suggests oversold conditions (potential bounce). It’s not a guarantee — it’s a probability tool.
Volume Price moves on high volume carry more conviction than moves on low volume. A breakout on heavy volume is meaningful. The same breakout on thin volume is suspect.
3. Valuation Models — What Is It Actually Worth?
This is where investing gets mathematical. Valuation models help you determine what a stock should be worth — and compare that to where it’s currently trading.
Discounted Cash Flow (DCF) The most respected valuation method. DCF projects a company’s future cash flows and discounts them back to today’s value using a required rate of return. If the intrinsic value is higher than the current price, the stock may be undervalued. The downside: it’s only as good as your assumptions about future growth.
Price-to-Book Ratio (P/B) Compares the stock price to the company’s net asset value (book value). A P/B under 1.0 can signal undervaluation — the market is pricing the company below what its assets are worth. Common in banking and industrial sectors.
EV/EBITDA Enterprise Value divided by Earnings Before Interest, Taxes, Depreciation, and Amortization. This metric is useful for comparing companies with different debt structures and is less susceptible to accounting manipulation than P/E alone.
4. Qualitative Analysis — The Stuff the Numbers Don’t Show
Numbers matter. But they don’t tell the whole story.
Some of the most important factors in evaluating a stock can’t be found in a spreadsheet.
Competitive Moat Does the company have a durable advantage that protects it from competition? Think brand loyalty (Apple), network effects (Visa), cost advantages (Costco), or switching costs (Salesforce). Companies without moats are always one disruption away from irrelevance.
Management Quality Who is running the company? Are insiders buying or selling shares? Is leadership transparent with shareholders? A great business run by mediocre management will underperform over time.
Industry Tailwinds Is the company operating in a growing market? Even an average company in a booming industry can outperform. Even an excellent company swimming against a dying industry has an uphill battle.
Customer Concentration If one customer represents 40% of revenue, that’s not a business — that’s a dependency. Diverse revenue streams mean more resilient earnings.
5. Comparing Approaches — Which One Should You Use?
The honest answer: all of them, together.
| Method | Best For | Limitation |
|---|---|---|
| Fundamental Analysis | Long-term buy/hold decisions | Doesn’t tell you when to buy |
| Technical Analysis | Entry and exit timing | Doesn’t tell you what to buy |
| Valuation Models | Finding under/overvalued stocks | Dependent on growth assumptions |
| Qualitative Analysis | Identifying durable businesses | Subjective, hard to quantify |
The investors who consistently outperform over time aren’t using one tool. They’re using a framework that combines all four — finding great businesses (fundamental), at a fair or discounted price (valuation), with favorable market momentum (technical), in a sector with structural tailwinds (qualitative).
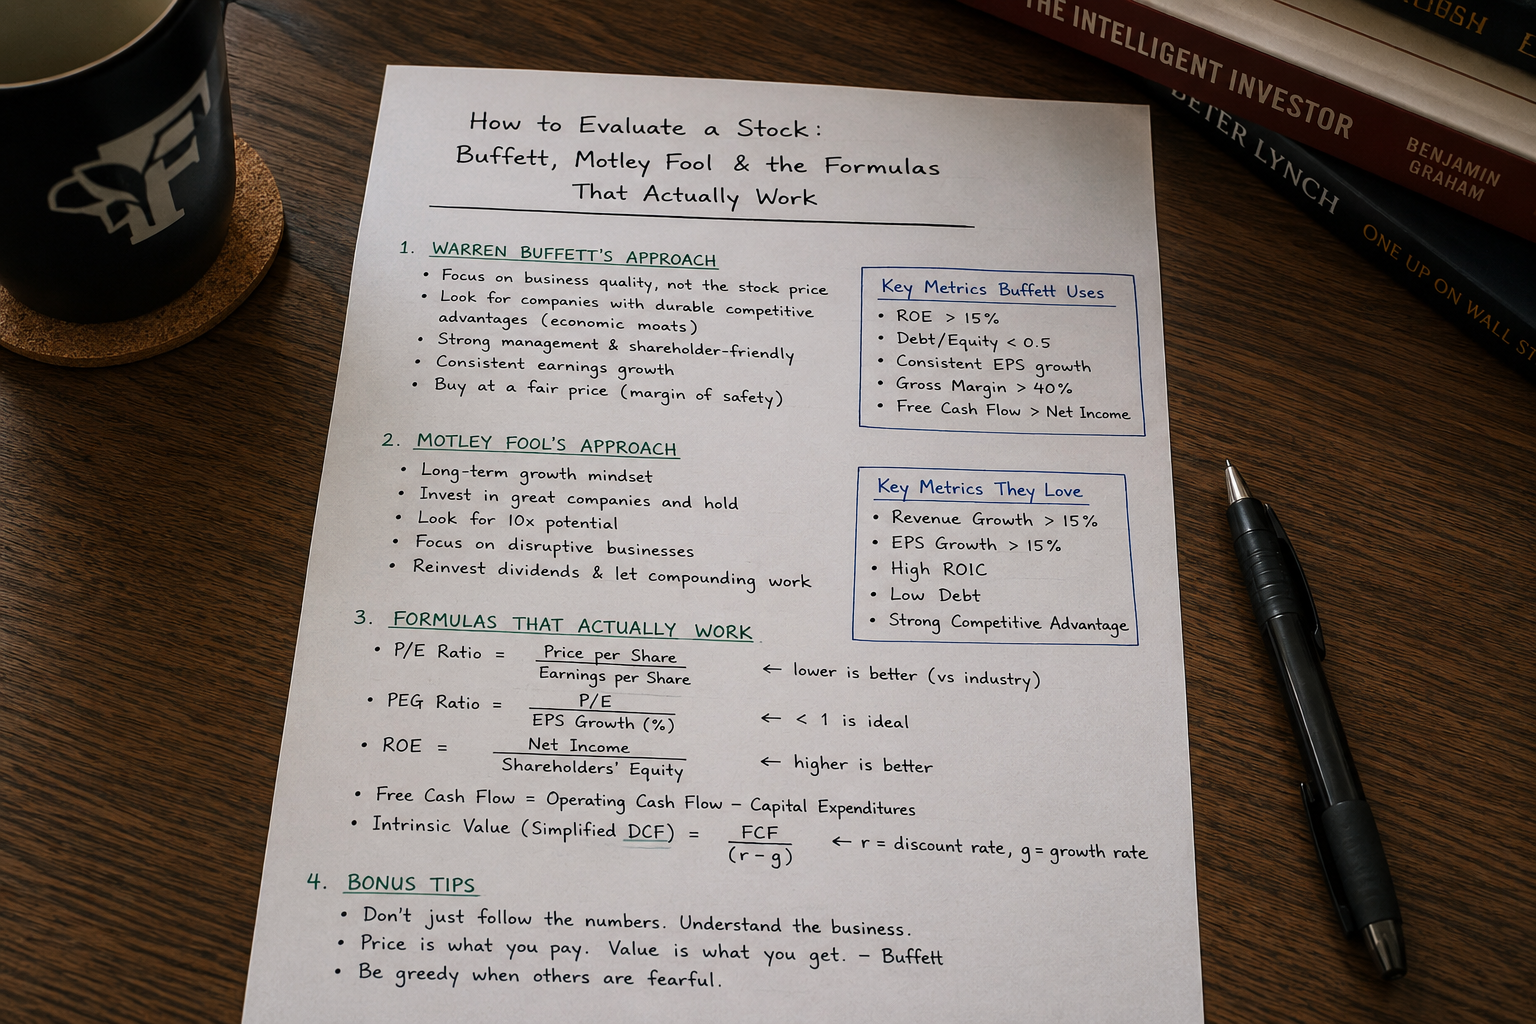
6. The Warren Buffett Framework — Buy Wonderful Companies at Fair Prices
Warren Buffett is arguably the most studied investor in history, and his approach is deceptively simple: find exceptional businesses, understand them deeply, and buy them when the price makes sense. He doesn’t chase hot sectors or time the market. He buys companies he’d be comfortable holding for 20 years.
His framework is rooted in the teachings of Benjamin Graham (his mentor) but evolved into something more focused on quality over raw cheapness.
The Formulas and Filters Buffett Uses:
Owner Earnings Buffett prefers “owner earnings” over reported net income because it reflects actual cash the business generates for shareholders. The formula:
Owner Earnings = Net Income + Depreciation & Amortization − Capital Expenditures − Working Capital Changes
This strips out accounting noise and gets to what the business actually puts in your pocket.
Intrinsic Value Buffett doesn’t use a fixed formula for intrinsic value — but he describes it as the discounted value of all cash a business will produce between now and its end. In practice, he looks for businesses where the future cash flows are predictable, because only then can you reasonably discount them. Unpredictable cash flows make valuation speculative.
Return on Invested Capital (ROIC) One of Buffett’s most-used filters. ROIC measures how efficiently a company turns invested capital into profit:
ROIC = Net Operating Profit After Tax (NOPAT) ÷ Invested Capital
He wants to see ROIC consistently above 15%, ideally above 20% for many years. This signals the company has a true competitive advantage — not just a lucky quarter.
The 10-Year Payback Test A Buffett-style gut check: if you paid today’s market cap in full, how many years of current earnings would it take to recoup your investment? Under 10 years is generally favorable. This forces you to confront whether you’re overpaying regardless of how exciting the story sounds.
The 4 Questions Buffett Asks:
- Is the business simple and understandable?
- Does it have a consistent operating history?
- Does it have favorable long-term prospects (a moat)?
- Is management rational and shareholder-oriented?
Only after those four boxes are checked does price enter the conversation.
Buffett on Price vs. Value
His most quoted principle: “It’s far better to buy a wonderful company at a fair price than a fair company at a wonderful price.”
This is the evolution from pure Graham-style deep value (buy anything cheap enough) to quality-first investing. A mediocre business bought at a bargain is still a mediocre business. A great business bought at a reasonable price compounds wealth for decades.
7. The Motley Fool Approach — Growth, Story, and Long-Term Conviction
The Motley Fool takes a different angle than Buffett — more growth-oriented, more focused on disruptive companies, and more willing to pay a premium for businesses they believe will be dramatically larger in 5–10 years.
Their philosophy is built around one core belief: the biggest risk in investing isn’t volatility — it’s being out of the market or too conservative with great companies.
The Motley Fool’s Core Evaluation Framework:
The AKER Framework (their internal checklist) Motley Fool analysts evaluate stocks across four dimensions:
- Addressable Market — Is the total market opportunity large enough to support significant growth? They want to see multi-billion or multi-trillion dollar TAMs (Total Addressable Markets).
- Key Metrics — What are the metrics specific to this business that predict future success? For a SaaS company it might be Net Revenue Retention. For a retailer, same-store sales. They reject one-size-fits-all metrics in favor of business-specific KPIs.
- Execution — Is management actually delivering? Are they hitting their own targets? Is the strategic roadmap being followed?
- Resilience — Can the business survive adversity? Recessions, competition, disruption? Motley Fool looks for businesses with multiple growth levers so no single setback is fatal.
The Rule of 40 (for SaaS and tech companies) A popular Motley Fool filter for software businesses:
Revenue Growth Rate (%) + Profit Margin (%) ≥ 40
A company growing revenue at 35% with a 10% profit margin scores 45 — passing the test. This balances growth against profitability in a way that pure revenue metrics miss. Companies consistently above 40 tend to be high-quality software businesses.
Net Revenue Retention (NRR) Motley Fool places heavy emphasis on this metric for subscription and SaaS companies:
NRR = (Starting MRR + Expansion − Churn − Contraction) ÷ Starting MRR × 100
An NRR above 120% means existing customers are spending 20% more than they were a year ago — even before counting new customers. That’s a compounding engine. They want to see 110%+ as a baseline for high-quality growth businesses.
Price-to-Sales (P/S) in Context For high-growth companies that aren’t yet profitable, Motley Fool uses Price-to-Sales rather than P/E. The key is context: a P/S of 20x is alarming for a slow-growing legacy business but reasonable for a company doubling revenue annually in a massive market. They evaluate P/S relative to growth rate and competitive position, not in a vacuum.
Long-Term Thinking Over Short-Term Noise Perhaps their most important principle: Motley Fool actively tells investors to ignore quarterly earnings beats and misses and focus on whether the 3–5 year thesis is intact. They hold through volatility because they believe short-term price movements are mostly noise relative to long-term business fundamentals.
Where Buffett and Motley Fool Diverge
| Factor | Warren Buffett | Motley Fool |
|---|---|---|
| Company Type | Mature, predictable, moat-heavy | High-growth, disruptive, often pre-profit |
| Valuation Tolerance | Pays fair prices, rarely premium | Willing to pay up for long-term growth |
| Key Metric | ROIC, Owner Earnings | NRR, Rule of 40, TAM |
| Holding Period | Forever if possible | 3–5+ years minimum |
| Volatility Stance | Avoid overpaying upfront | Hold through it; zoom out |
| Primary Risk Focus | Overpaying for mediocre businesses | Being too conservative; missing big winners |
Neither approach is wrong. Buffett built the greatest long-term investment record in history with mature, cash-generating businesses. Motley Fool’s Stock Advisor has historically outperformed the S&P 500 by identifying growth companies early. The best investors understand both lenses and apply them situationally.
The Bottom Line
Investing without evaluation is speculation. Speculation is fine if you can afford to lose what you’re risking — but it’s not a wealth-building strategy.
Build your process. Know your metrics. Understand what you own and why you own it. The market will test you — and the only investors who stay calm during a drawdown are the ones who did the work before they bought.
Do the work.
This article is for informational and educational purposes only and does not constitute financial advice. Always conduct your own research or consult a licensed financial professional before making investment decisions.